Expectancy is the average result per trade across many trades. Measured in R it is simply the mean R multiple: +0.3R means that, on average, each trade has returned three-tenths of the amount it risked. Positive expectancy means the approach has made money over the sample; negative means it has lost.
What is the expectancy formula?
Two ways of writing the same thing:
- Average R = sum of the R multiples ÷ number of trades that have an R.
- From its parts = (win rate × average winning R) − (loss rate × average losing R).
The second form is useful because it shows which lever to pull: win more often, win bigger, or lose smaller.
Expectancy can also be stated in money — net result ÷ number of trades — but that number changes whenever your position size does, so R is the fairer unit for judging the method itself.
Worked example
Over 100 trades, 40 won with an average of +2.5R and 60 lost with an average of −1R.
(0.40 × 2.5) − (0.60 × 1) = 1.0 − 0.6 = +0.4R per trade. Risking $100 a trade, those 100 trades averaged about $40 each, or roughly $4,000 in total.
Can a high win rate still lose money?
Yes, and it is common. Win 70% of the time at +0.4R, lose the other 30% at −1.2R, and the expectancy is (0.7 × 0.4) − (0.3 × 1.2) = −0.08R. Each small win feels like progress while the account drifts down. Win rate only tells half the story; expectancy adds the size of wins and losses back in.
How many trades does expectancy need?
There is no magic number, but a handful is never enough: one large winner can make ten trades look brilliant. Compare like with like — the same setup, the same market conditions — and treat anything under a few dozen trades as a hint rather than a verdict.
Expectancy in ApeX Journal
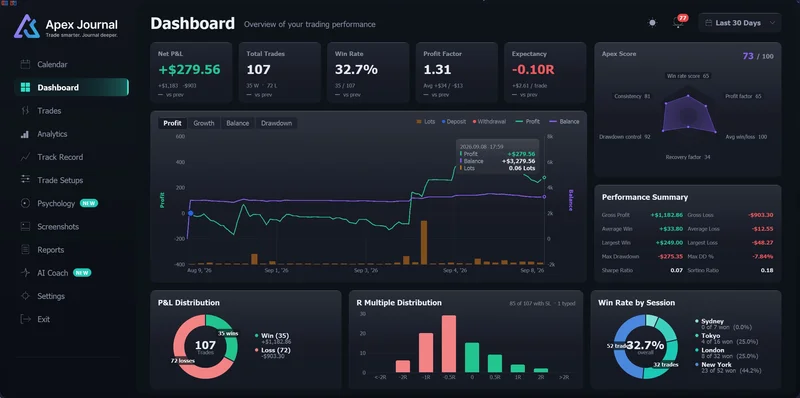
The Dashboard shows expectancy in R, averaged over the trades that had a stop loss, with the money per trade underneath and how it moved compared with the equally long stretch just before. If none of the trades in the range had a stop, it falls back to money per trade instead of showing a misleading 0R. Analytics ranks your setups by result per trade once a setup has at least ten trades, and the Duration tab can score each hold-time band by expectancy.
Questions
What is a good expectancy in trading?
Anything reliably above zero after costs means the approach has an edge. Even a small positive figure such as +0.2R adds up over hundreds of trades; what matters more than the size is that it holds up across a large sample and different market conditions.
Is expectancy the same as profit factor?
No. Expectancy is an average per trade; profit factor is a ratio of total winnings to total losses. Both are above break-even at the same time — expectancy above zero, profit factor above 1 — but expectancy tells you how much each trade is worth, which profit factor does not.
Why measure expectancy in R instead of money?
Because R removes position size. If you doubled your lot size halfway through the month, the money expectancy jumps while the method stayed exactly the same; the R expectancy does not move.