An MT5 trading journal is a tool that collects the trades from your MetaTrader 5 account, keeps them alongside what you add yourself — the setup, your notes, how you felt — and then measures the lot: results by day and by setup, how much of each move you captured, which hours and habits lose money, and whether the numbers are improving month to month.
ApeX Journal is one of these, built as an indicator that runs inside MetaTrader 5 itself. It reads the account history for you, so there is no spreadsheet to keep and nothing to upload.
Isn't the History tab in MetaTrader enough?
It is a complete record, and it is the right source — every journal worth using starts from it. What it cannot do is answer questions. It lists deals; its built-in report summarises the account as a whole. Neither knows why you took a trade, which pattern it was, or what was going through your head, and neither lays the results out in the shapes that make a habit visible.
| The question | MetaTrader 5 on its own | With ApeX Journal |
|---|---|---|
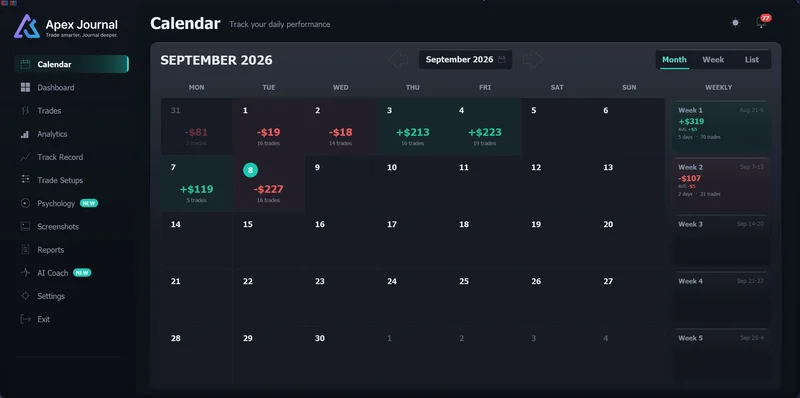
| How did each day go? | Filter the history by date, one range at a time. | A month on one screen, with any day opened into its own breakdown. |
| Which setup makes money? | Only whatever you typed into the order comment. | Your own setups, tagged per trade and ranked by result. |
| Results in R | Not shown — money and points only. | Every trade that had a stop loss is measured in R. |
| Notes and emotions | Nowhere to keep them. | Stored per trade, then totalled to show what each state costs. |
| Chart pictures | Saved as loose files, not tied to any trade. | Filed under the trade they belong to, in one gallery. |
| Am I getting better? | One report for whatever range you pick. | Finished months or weeks lined up next to each other, plus a list of drawdowns. |
| When did the stop move? | Not kept — the terminal stores only the final levels. | Kept for trades taken while ApeX Trade Manager was running. |
What should a trading journal record?
Three layers, and only the first comes for free.
- What happened. Symbol, direction, entry and exit, size, profit, how long the trade was open and the session it fell in. The broker already has all of this; a journal should pull it in, not ask you to type it.
- What you intended. The setup, the stop that defines one unit of risk, the rules you meant to follow. Without the stop there is no R; without the setup there is no way to tell a good pattern from a lucky week.
- What you were thinking. A note, the emotion, whether you kept to the plan. This is the layer that explains losing streaks that the price chart alone never will.
The value comes from joining them. "Breakouts lose money" is a guess; "breakouts taken in the first hour of London, tagged as FOMO, average minus half an R" is something you can act on tomorrow.
What is inside ApeX Journal
Eleven pages in one near-full-screen window that opens from a small bar on the chart: Calendar, Dashboard, Trades, Analytics, Track Record, Trade Setups, Psychology, Screenshots, Reports, AI Coach and Settings. English and Thai are built in.
Calendar and Dashboard — where you stand
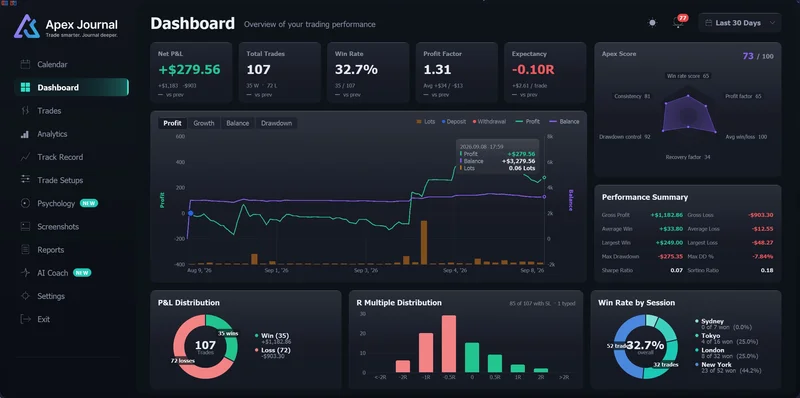
The calendar colours each day by its result and adds a weekly total. Click a day and a side panel breaks it down: a cumulative line trade by trade, best and worst trade, the symbol and session that carried it, and a score out of 100 drawn as a six-axis radar. The dashboard does the same for a rolling window — all time, this year, this month or the last 30 days — and puts each headline figure, from win rate and profit factor to expectancy and average R, next to its value for the equal-length window just before.
Trades — every position, searchable
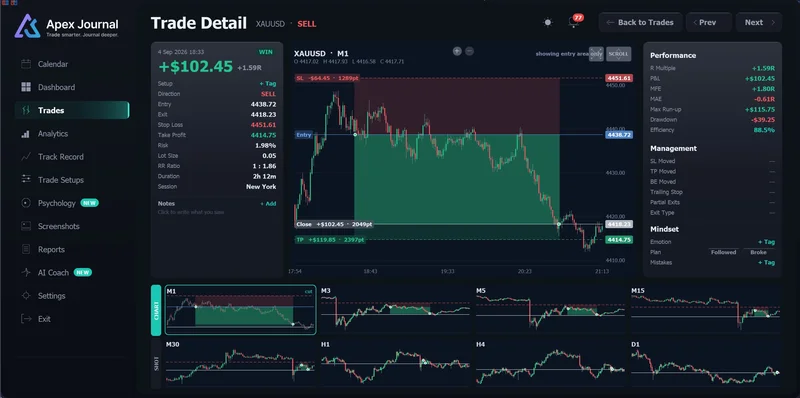
A table of closed trades with filters for symbol, direction, session, result, setup and hold time, plus a search box and export to CSV. Opening a row plots the trade over the actual candles, marking entry, exit and levels, and lists what it risked, its R multiple, how far price ran in its favour and against it, and how much of that run the exit kept. Partial closes and how the last piece left are listed too, and this is where you write the note and tag the emotion.
Analytics — how you trade, not how much you made
Four tabs, each built around one question.
- MFE / MAE — are your stops and targets the right size for the moves you actually get? Each trade is plotted by its best and worst excursion, and winners get a grade based on the share of the move they kept.
- Setup — which setups earn per trade, how a base setup changes when a second tag is present, and whether keeping a checklist rule changes the average R.
- Time — a day-by-hour heatmap, sessions against weekdays, and your best day of the week.
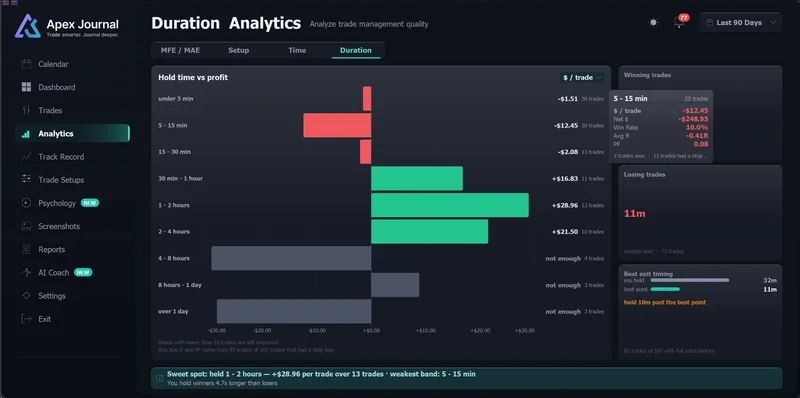
- Duration — nine hold-time bands from a few minutes to more than a day, the median time you hold winners against losers, and how long you tend to stay after price has already peaked.
What R multiple, expectancy, profit factor, drawdown and MFE/MAE mean →
Track Record and Reports — closing the books
Track Record lays out finished months or weeks next to each other: a monthly returns heatmap, the deepest drawdowns and their length, plus one row for every period. Click a period and Reports opens on it — a fixed daily, weekly or monthly report compared with the period before, which you can export as a CSV for a spreadsheet or as an HTML page to keep or send.
Trade Setups and Psychology — the part you add
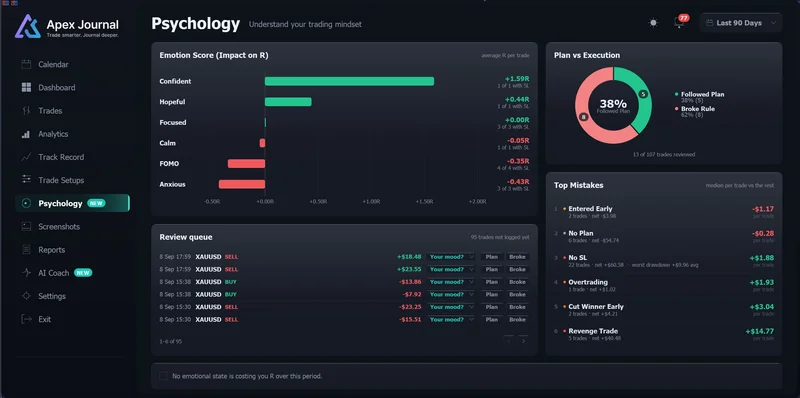
You name your own setups, give each a checklist and mark the rules that are not optional. Untagged trades wait in a queue, and several can be tagged in one go. Psychology ranks the emotions you have logged by average R, sets the common mistakes — no stop, oversized risk, revenge trades, cutting a winner early and others — against the rest of your trades, and counts how often you followed the plan.
AI Coach
Optional and off until you set it up. It reads the closed trades of the period you pick, ranks the leaks by what they cost, and answers questions about your own trading — it does not predict markets or suggest entries. It runs on your own account with Anthropic, OpenAI, Google Gemini, xAI or DeepSeek, or on a local Ollama model, and the free ApeXAiBridge service carries the request because MetaTrader does not let an indicator go online. You can read the exact text before it is sent; your balance, login, broker name and images are never part of it.
Does it need ApeX Trade Manager MT5?
No. Every page above works with ApeX Journal alone, on trades placed any way you like — by hand, from the phone or by another Expert Advisor. On its own, you tag the setup after the trade has closed.
Running it next to ApeX Trade Manager (sold separately) adds what only the trade manager can know, because it holds your plan before the order exists:
- A Trade Card on the chart where you pick the setup, tick its checklist and write your reasoning before you enter.
- A camera on that card, which captures the chart and files the picture under the trade.
- The management history of each trade — every stop and target move with its time, the break-even move, whether trailing ran and in which mode, and the level each partial close came from.
- Plan against actual, both on the trade and inside the AI Coach.
These are captured as you trade, so they exist only for trades taken while both programs were running.
What ApeX Trade Manager does as an MT5 trade manager →
Where does the data live?
On your own computer, in a single database file inside the MetaTrader 5 data folder that holds every account you have used. There is no cloud copy and no account to sign up for. New closed trades are picked up on their own, deposits and withdrawals are counted so drawdown percentages stay honest, and several terminals can share the database at once. The only data that ever leaves the machine is the AI Coach request, and only when you have switched it on.
What it cannot tell you
Some limits come from MetaTrader itself, and no journal can work around them. Better to know them now.
- No equity curve after the fact. The terminal never saves floating profit over time, so the growth chart plots balance and shades the drawdown underneath.
- No stop, no R. R figures count only trades that had a stop loss. For a trade placed without one you can enter the stop you had in mind, and it stays marked as typed by you.
- Old stop moves are gone. MetaTrader does not log edits to the stop loss or take profit, which means break-even and trailing history cannot be rebuilt for trades nobody was recording.
- It does not trade. It is an indicator: it never sends, changes or closes an order.
- Sharpe and Sortino are per trade. They ignore the risk-free rate and are not scaled to a year — fine for setting your own periods against each other, not for lining up against a fund.
Questions
What is an MT5 trading journal?
It is a tool that takes the trades from your MetaTrader 5 account, adds what the account does not know — the setup, your notes and your state of mind — and measures the result, so you can see which patterns, hours and habits make or lose money and whether you are improving over time.
Do I have to enter trades by hand?
No. ApeX Journal reads the account history from MetaTrader 5 the first time it runs and keeps itself up to date after that, including deposits and withdrawals. What you add by hand is only what the broker cannot know: the setup, notes and emotions.
Is ApeX Journal an indicator or an Expert Advisor?
An indicator. It reads history and draws on the chart but cannot send or change orders, so it is safe to run next to any Expert Advisor, including ApeX Trade Manager.
Does it work with trades I did not place through ApeX?
Yes. Every closed trade on the account is imported, whether it was opened by hand, from the mobile app or by any Expert Advisor. Only the management history — stop and target moves, break-even and trailing — needs ApeX Trade Manager to have been running when the trade was taken.
Does ApeX Journal work with ApeX Trade Manager?
Yes. The Journal works alone with trades from any source, and next to ApeX Trade Manager (sold separately) it adds what only the trade manager knows: the setup, checklist and reasoning chosen on the Trade Card before entry, chart pictures taken from that card, each trade's stop and target moves, break-even, trailing and partial closes, and plan against actual in the AI Coach. These are recorded only for trades taken while both were running.
Can it show my equity curve?
It shows a balance curve with drawdown shaded underneath. MetaTrader 5 never stores floating P&L over time, which is why no journal can rebuild a true equity curve afterwards; deposits and withdrawals are marked on the chart so they are not mistaken for trading results.
Does my trading data get uploaded anywhere?
No. Everything is kept in a database on your own computer, with no cloud sync and no sign-up. The one exception is the optional AI Coach, which sends a text summary of closed trades to the AI provider you chose; the full text is shown to you before sending, and it never includes your balance, login, broker name or images.
What does the AI Coach cost?
Nothing from us: it uses your own API key, and any usage is billed by that provider. Google Gemini offers a free key with usage limits, and a local Ollama model needs no key at all. You can also set a daily request cap in the Journal's settings.
Try it on your own history
The demo edition runs on demo accounts for a free trial period, and builds its pages from that account's real history — the quickest way to see what your own numbers look like.
Read the ApeX Journal user manual — install, activate and every page explained →