ApeX Indicator ICT Concepts puts the core ICT tools on a MetaTrader 5 chart: market structure shifts and breaks of structure, order blocks, buyside and sellside liquidity, fair value gaps and inversion gaps, volume imbalances, displacement, opening gaps for each new week and each new day, an automatic Fibonacci and the four killzones. Each tool has its own switch, so you show only what you trade.
How do I install it?
- Buy ApeX Indicator ICT Concepts on the MQL5 Market with the same MQL5 account you use in your terminal. MQL5 handles the licence.
- In MetaTrader 5 open Toolbox › Market › Purchased and press Install. It appears in the Navigator under Indicators › Market.
- Drag it onto a chart and press OK. The ApeX Indicator bar appears with an ICTc chip.
The free MQL5 demo runs only in the Strategy Tester: the drawing is complete there, but the bar cannot be clicked.
The ApeX Indicator bar
The same bar every ApeX indicator uses: one bar per chart, one chip per indicator. Drag the words ApeX Indicator to move it; ● ICTc shows or hides the indicator; ☰ opens the picker, where the tick column sets which indicators get a chip and the ● / ○ column which are drawn, with Show all and Hide all for every ApeX indicator at once. With ApeX Trade Manager on the same chart, the Combine switch docks the bar onto the trade manager panel; without it the switch reads ApeX Console not found.
The bar in more detail, with a picture →
What does it draw on the chart?
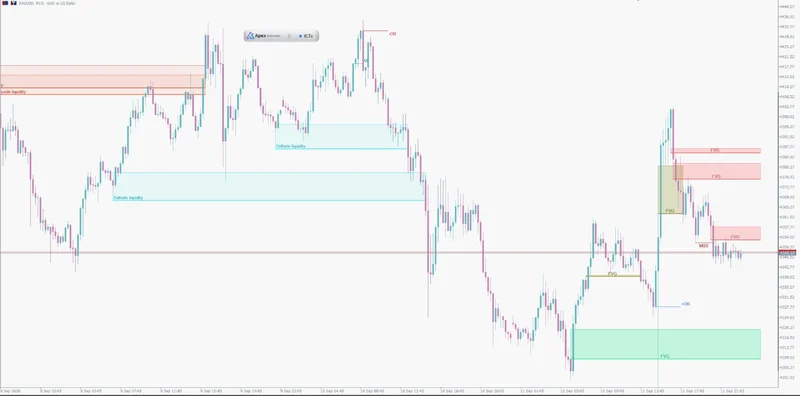
- MSS / BOS — a market structure shift is the first break against the trend; a break of structure continues it. Separate bullish and bearish colours for each make them easy to tell apart at a glance.
- Order blocks — the last one on each side by default, built from candle bodies or from the whole candle including wicks.
- Liquidity — pools of equal highs (buyside) and equal lows (sellside) where stops are resting.
- FVG / iFVG, volume imbalance — three-candle gaps, gaps that were traded through and flipped, and the thin body-to-body gaps between neighbouring candles.
- NWOG / NDOG, Fibonacci, killzones, displacement — opening gaps of the week and the day, a retracement that follows the latest structure, shaded sessions, and the candles that moved hard enough to count as intent.
What should I set first?
If you use killzones, check the shading against a session whose hours you know for certain before relying on it, because the chart runs on your broker's server time rather than yours. Each session has its own start and end time, and there is a broker offset setting; adjust them until the shading sits where it should. If you also run the auto trading in ApeX Trade Manager, keep the liquidity Margin the same in both programs, so the pools you see are the pools it trades on.
Settings by topic
Questions
Why are the killzones shaded at the wrong time?
Because the chart runs on your broker's server time, which is rarely your local time or UTC. Compare the shading with a session whose hours you know, then adjust that session's start and end times, or the broker offset setting, until it lines up.
What is the difference between MSS and BOS?
An MSS (market structure shift) is the first break against the current trend, an early sign the direction may be changing. A BOS (break of structure) breaks in the same direction as the trend and confirms it is continuing. The indicator colours them differently.
Does ApeX Indicator ICT Concepts trade by itself?
No. Indicators cannot send orders in MetaTrader 5. It publishes its structure shifts with the matching order block, gap and liquidity information, and ApeX Trade Manager can trade on them if you run it on the same terminal.
Can I run it together with ApeX Indicator SMC?
Yes. Both share one ApeX Indicator bar on the chart, each with its own chip, and each can be shown or hidden separately.