ApeX Indicator Volume Profile draws a volume profile for every swing on a MetaTrader 5 chart. Each profile runs from one pivot high or low to the next, so you see where volume built up during each move: the Point of Control (the busiest price), the value area around it, and labels at each pivot with the price, the size of the move and the volume traded. It can also colour the candles by how their volume compares with the average.
How do I install it?
- Buy ApeX Indicator Volume Profile on the MQL5 Market with the same MQL5 account you use in your terminal. MQL5 handles the licence.
- In MetaTrader 5 open Toolbox › Market › Purchased and press Install. It appears in the Navigator under Indicators › Market.
- Drag it onto a chart and press OK. The ApeX Indicator bar appears with a VP chip.
The free MQL5 demo runs only in the Strategy Tester: the drawing is complete there, but the bar cannot be clicked.
The ApeX Indicator bar
The same bar every ApeX indicator uses: one bar per chart, one chip per indicator. ● VP shows or hides the profiles; ☰ opens the picker for every ApeX indicator on the chart. With ApeX Trade Manager on the same chart, the Combine switch docks the bar onto the trade manager panel.
The bar in more detail, with a picture →
What does it draw on the chart?
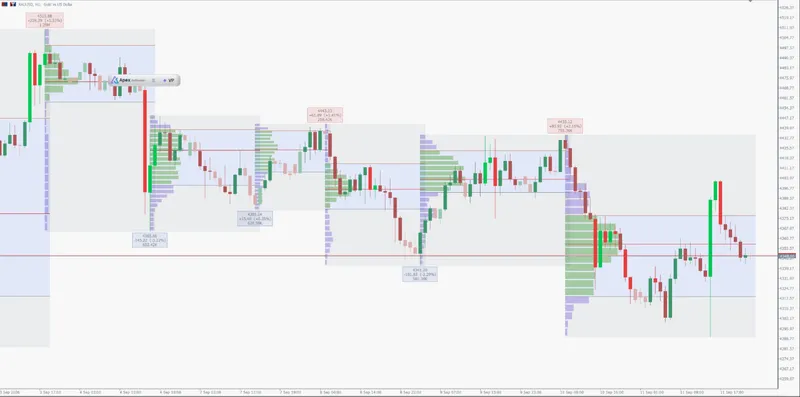
- Profile — horizontal rows showing how much volume traded at each price during the swing. A longer row means more volume.
- PoC — the Point of Control, the price with the most volume in the swing (red line).
- VAH / VAL — the top and bottom of the value area, the price band that holds 68% of the swing's volume by default, with a light fill between them.
- Pivot labels — at each pivot: its price, the change from the previous pivot in price and in percent, and the total volume of the swing that ended there.
- Volume weighted candles — brighter candles had much more volume than usual, paler ones much less.
How is each profile built?
- The indicator finds pivots: a candle whose high (or low) is the highest (or lowest) of the 20 candles on each side of it.
- Between each pair of neighbouring pivots it splits the price range into 25 rows and spreads each candle's volume over the rows its range covers.
- The busiest row becomes the PoC. The value area grows outward from it, one row at a time towards the busier neighbour, until it holds 68% of the volume.
A pivot is only confirmed once 20 more candles have closed after it. Until then, the last profile runs from the latest confirmed pivot to the current candle and keeps updating as new candles come in.
Profile settings
Open the settings through Indicators List on the chart's right-click menu. Defaults are shown after each name.
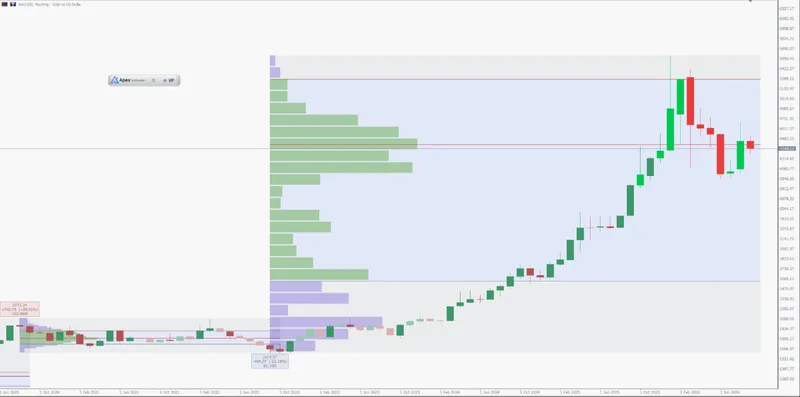
- Pivot Points Left / Right Length — 20. Larger values find fewer, bigger swings and longer profiles; smaller values find more, shorter ones, and confirm them sooner.
- Volume Profile (Common Interest) — on. Switches the profile rows on or off; the lines and labels can stay. Row colours inside and outside the value area each have their own opacity, 100 of 255.
- Value Area Volume % — 68. Number of Rows — 25. More rows give a finer profile.
- Point of Control (PoC) — on, red. Extend Point of Control (PoC) — None. Right carries the line forward until price trades back through it, which makes untested PoCs easy to spot; Both extends it in both directions.
- Value Area High (VAH) / Value Area Low (VAL) — on. Value Area Background Fill — on. Profile Range Background Fill — on, a light box over the whole swing.
- Level Labels — Pivot Points, the labels at each pivot. Volume Profile puts price tags on the PoC, VAH and VAL instead; Both shows the two kinds; None hides them. Size — Small. The choices are Small, Normal and Large.
- Price / Price Change / Cumulative Volume — all on. Choose which lines the pivot labels show. Label colours for highs, lows and text are separate.
- Placement — Left: rows grow from the left edge of the swing. Right grows them from the right edge. Profile Width % — 30% of the swing's width.
Volume weighted colored bars
- Volume Weighted Colored Bars — on. Recolours each candle by comparing its volume with the recent average. Volume Moving Average Length — 89 candles.
- Bold Bars above Volume Average x — the bold colour goes to candles whose volume is more than 1.618 times the average (the default). Light Bars below Volume Average x — the light colour goes to candles under 0.618 times the average (the default). Everything between keeps the normal colour.
- Bull and bear each have bold, normal and light colours.
Drawing
- Volume source — Tick volume. Real volume is used only where your broker supplies it; on symbols without it the indicator falls back to tick volume.
- Alpha — the strength of the value area fill (26), the profile range fill (20) and the pivot labels (60), from 0 (clear) to 255 (solid).
- Space between profile rows — 5 px. Level line width — 1 px. Draw behind candles — on.
- Hide bitmaps when — Never (default, recommended). The profiles move with the candles while you drag the chart. Chart move hides them while you pan or zoom. Redraw delay after chart is idle — 120 ms.
- Max profiles kept in memory — 12, the newest swings (up to 64). Bars to scan for pivots — 3000. Max simultaneous bitmaps — 48.
Questions
Why does the last profile keep changing?
Because its swing has not finished. It runs from the latest confirmed pivot to the current candle, so each new candle adds volume to it. It stops changing once the next pivot is confirmed, 20 candles after that pivot with the default length.
Tick volume or real volume?
Most forex and CFD brokers only provide tick volume, the number of price changes, which follows real activity closely enough for profiles. Choose real volume on exchange-traded symbols such as futures or stocks where your broker supplies it.
I see too many small profiles. What should I change?
Raise Pivot Points Left / Right Length, for example to 30 or 50, so only bigger swings count. Lowering Max profiles kept in memory also clears older ones from the chart.
Can I run it together with the other ApeX indicators?
Yes. They share one ApeX Indicator bar on the chart, each with its own chip, and each can be shown or hidden separately.