MFE (maximum favourable excursion) is the furthest price moved in your favour while a trade was open. MAE (maximum adverse excursion) is the furthest it moved against you. Both are measured from the entry price and are usually expressed in R, so trades of different sizes can be compared.
How are MFE and MAE measured?
- MFE = the best price reached between entry and exit, minus the entry (for a buy; the other way round for a sell).
- MAE = the entry minus the worst price reached in the same window.
- Divide either by the distance to the original stop to express it in R.
When calculated from candle highs and lows rather than every tick, a sudden spike — a spread jump on news, for example — inflates both figures for that trade.
Worked example
Buy gold at 2,000 with the stop at 1,990, so 1R is 10 dollars of price. While the trade was open price rose as high as 2,025 and fell as low as 1,994. You closed at 2,012.
- MFE = 25 ÷ 10 = +2.5R
- MAE = 6 ÷ 10 = −0.6R
- Result = 12 ÷ 10 = +1.2R, leaving 1.3R on the table.
What is exit efficiency?
The share of the MFE that the exit kept: result ÷ MFE. In the example, 12 ÷ 25 = 48%. A trade that closed at a loss kept none of its favourable move, so its efficiency is 0% however far price ran first.
What do MFE and MAE reveal?
- Stops that are too wide. If your winning trades almost never go more than −0.3R against you, a stop at −1R is paying for room the winners never use.
- Stops that are too tight. Many losers whose MAE sits right at −1R, followed by price going your way, suggest the stop sits where normal noise reaches.
- Targets that are too far. If few trades ever reach an MFE of 3R, a 3R target will rarely be hit.
- Winners turned into losers. Trades that were 1R or more ahead and still closed at a loss point to a missing break-even or trailing rule.
MFE and MAE in ApeX Journal
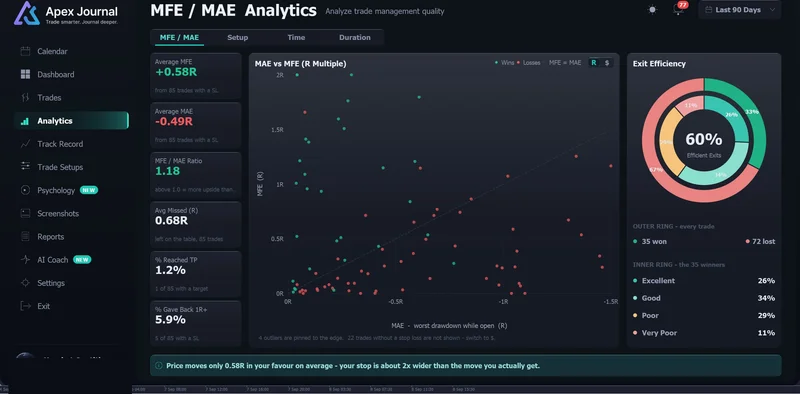
ApeX Journal works out MFE and MAE from real price history over the life of each trade, choosing a timeframe that covers the whole trade, so it works for trades taken long ago. The Trade Detail page shows them for one trade along with efficiency. The Analytics › MFE / MAE tab plots every trade by its best against its worst excursion, gives averages and the share of trades that were 1R ahead before closing at a loss, and grades winners in an Exit Efficiency donut: Excellent from 80%, Good from 50%, Poor from 25%, Very Poor below that.
Questions
Why does MAE matter on a winning trade?
Because it shows how much room a good trade actually needed. If winners rarely move far against you, your stop can often be tighter, which raises the R of every winner without changing how often you win.
Can MFE and MAE be calculated for old trades?
Yes, as long as the price history for that symbol and period is still available, because both come from where price went rather than from anything recorded during the trade. Calculating from candles rather than ticks is slightly less exact during sharp spikes.
What is a good exit efficiency?
Catching the very top is rare, so averages well below 100% are normal. Trend-following traders accept lower efficiency in exchange for bigger winners; the useful signal is a change over time or a large gap between setups.