Open the settings through Indicators List on the chart's right-click menu. The defaults give a clean chart: internal structure, swing structure, five internal order blocks and equal highs and lows are on; swing order blocks, fair value gaps, higher-timeframe levels and premium/discount zones are off until you want them.
General
- Mode — Historical (default) shows every structure, block and gap formed over the history that is loaded. Present shows only the ones still in play, so you see today's picture alone.
- Style — Colored uses your bullish and bearish colours; Monochrome turns everything grey, useful when you want to read structure without colour steering you.
- Color Candles — off by default. Colours the candles by the current trend; hiding the indicator from the bar puts your own candle colours back.
- Max bars to calculate — 1500. How far back it works. Lower it on a slow computer; raise it to see older structure.
Structure
Two levels of structure, each with its own switch, filters, colours and label size.
- Show Internal Structure — on. The short swings inside the bigger move.
- Show Swing Structure — on. The larger swings.
- Bullish / Bearish Structure — per side: All, BOS only or CHoCH only. Setting both sides to CHoCH shows only the points where direction changed.
- Confluence Filter — off. When on, an internal break is drawn only if the leg agrees with it; fewer labels, and fewer signals.
- Swing Length — 50. The one number that defines a swing, and with it swing order blocks, strong and weak highs and lows, and premium/discount. Smaller values give a busier, faster chart.
- Show Swings Points — off. Marks the swing highs and lows themselves.
- Show Strong/Weak High/Low — on. Labels each end of the current swing as strong or weak.
- Label Size — tiny for internal, small for swing.
Order blocks
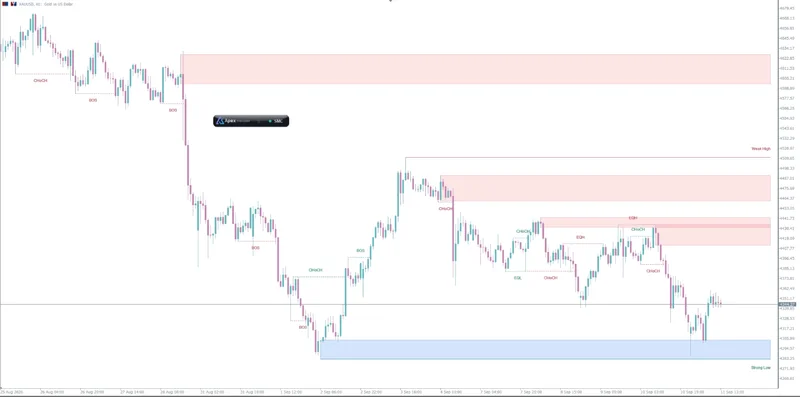
- Internal Order Blocks — on, 5 blocks. Swing Order Blocks — off, 5 blocks.
- Order Block Filter — the yardstick for whether a block is big enough to keep: ATR (default) or Cumulative Mean Range.
- Order Block Mitigation — when a block counts as used: High/Low (default) on the first touch, or Close only when a candle closes through it. Close keeps blocks longer.
- OB search window — 50: the furthest the indicator looks back from a break when locating its block; 0 removes the limit.
- Colours and OB Opacity — four colours, bullish and bearish for internal and for swing blocks, and an opacity of 51 out of 255.
EQH / EQL
- Equal High/Low — on.
- Bars Confirmation — 3. How many bars apart the two points must be.
- Threshold — 0.1. The price tolerance for calling two points equal; raise it to accept pairs that sit further apart.
Fair value gaps
- Fair Value Gaps — off, because on low timeframes they appear in large numbers.
- Auto Threshold — on. Small gaps are dropped, and only those above the recent average size remain.
- Timeframe — current by default. Pick a higher timeframe to see its gaps on a lower-timeframe chart, for example H1 gaps on M5.
- Extend FVG — 1 bar to the right. FVG Opacity — 77.
Highs & lows MTF
Daily, Weekly and Monthly — lines at the high and low of the last completed day, week and month. All three start switched off, and each can have a different colour and line style.
Premium and discount zones
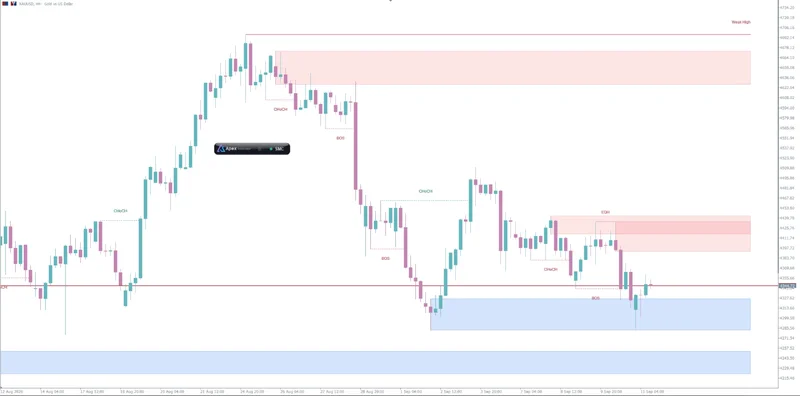
Premium/Discount Zones — off by default. When on, the range of the current swing is divided into three: premium at the top, equilibrium in the middle, discount at the bottom, so you can see at once whether a buy would be at the expensive end of the range. One colour per zone, opacity 51.
Drawing and chart speed
- Box Render Mode — with Bitmap (default), every box is a see-through image pinned to a time and price, and your clicks reach the chart objects beneath it. With Rectangle, boxes become normal chart rectangles filled with a pre-blended colour.
- Draw boxes behind the candles — on, so a zone never covers price.
- Hide boxes when — Never (default, recommended); Chart move hides them only while you pan or zoom; Mouse down is the older behaviour.
- Repaint delay after mouse release — waits 120 ms after the chart comes to rest, so a double-click is not interrupted by a redraw.
While a mouse button is held down, the indicator does not write to the chart at all, so drawing a trend line or dragging the second point of a Fibonacci works as it does on an empty chart.
Signals for ApeX Trade Manager
Only relevant if you also use ApeX Trade Manager. SMC publishes each structure break on a closed bar in a form the trade manager reads, and the trade manager can turn it into a trade — leaving a draft box for you to confirm, placing a pending order or entering at market, depending on how you set up the trade manager.
- Emit signals for the EA — on. Costs nothing when nothing is reading.
- Compute only — calculates without drawing. The indicator turns this on for itself in the hidden copy that the trade manager runs, and in the Strategy Tester, which is why you never see the boxes twice.
- [EA] overrides — let the trade manager supply its own swing length, OB search window, max bars and confluence filter. At 0 or −1 they are ignored and your values apply.
The boxes on your chart belong to the chart's timeframe. If the trade manager reads signals from a different timeframe, it is looking at its own hidden copy on that timeframe; open a chart on that timeframe to see what it sees.