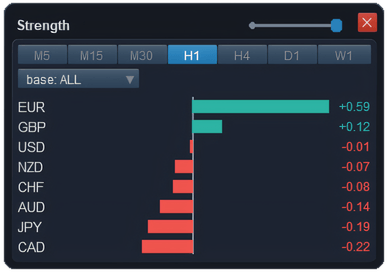
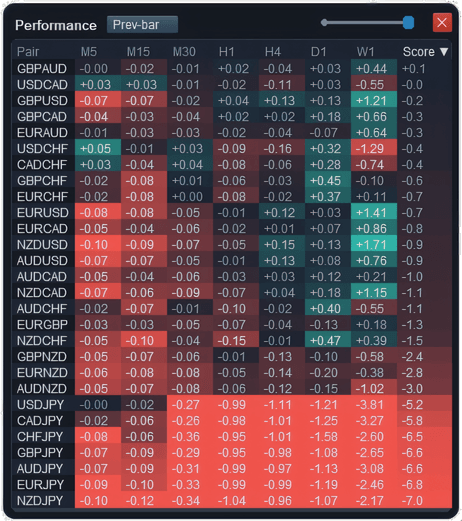
ApeX Trading Console, a trade manager for MetaTrader 5, has a currency strength meter and a performance table built in, both opened from the Tools bar on the chart. ☰S ranks the eight majors — EUR, GBP, AUD, NZD, USD, CAD, CHF and JPY — from strongest to weakest on the timeframe you choose, M5 to W1, using all 28 pairs between them. ☰P lists those 28 pairs with how far each has moved on seven timeframes, coloured green or red, and sorts them by a combined score. Both refresh every second, and a double-click on a pair in the table switches your chart to it.
Opening them
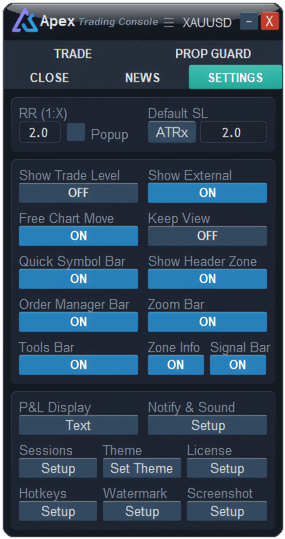
Both live on the Tools bar: ☰P opens Performance and ☰S opens Strength. If the bar is not on your chart, turn Tools Bar on in the panel’s Settings tab. A second press on ☰P or ☰S closes that window, and so does its X. You can have both open at once.

The first time you open either one, the console finds the 28 pairs under your broker's names — EURUSD.a or EURUSDm work too — adds them to Market Watch, and waits for their history. That can take a few seconds; after that the windows open with numbers straight away.
How do you see which currency is strongest in MT5?
- Press ☰S on the Tools bar.
- Pick a timeframe along the top row: M5, M15, M30, H1, H4, D1 or W1. The chosen one turns blue.
- Read the bars. The strongest currency is at the top and the weakest at the bottom. Green bars reach right of the centre line, red bars reach left, and the number at the end is the score.
A simple way to use it: the currency at the top against the one at the bottom is the pair with the most pull behind it on that timeframe. Seeing the same pair at the top of the Performance table is a second opinion.
While the data is loading, the window shows a progress list instead of bars: first "Loading symbols", then "Processing all timeframes", with a bar for each pair and one for all of them. Once that finishes, switching timeframe is instant.
What does "base" change?
The button under the timeframes reads "base: USD" to begin with. Click it to choose ALL or any of the eight currencies.
- With a currency chosen, that currency sits at exactly 0 and every other one is measured against it. With USD as the base, a green EUR means the euro is doing better than the dollar.
- With ALL, each currency is shown against the whole group, so the bars spread either side of zero.
The order from strong to weak is the same either way; only where zero sits changes. The timeframe and base you pick are remembered.
How is currency strength worked out?
Every one of the 28 pairs casts a vote. The vote is how far the pair has moved on the chosen timeframe, divided by that pair's normal range there — its 14-period ATR as a percentage of price. The vote goes to the first currency in the pair as a plus and to the second as a minus. Each currency's score is the average of its votes, over however many of its pairs your broker offers.
Dividing by ATR is what keeps it fair. GBPJPY can travel three times as far as EURGBP on an ordinary day; without it, the pound and the yen would top and tail the list just for being lively.
"How far the pair has moved" is the same measure the Performance window uses — from the last candle's close, or from the current candle's open, whichever that window is set to.
What does the Performance table show?
Press ☰P. The window lists the 28 major pairs in rows, with a column each for M5, M15, M30, H1, H4, D1 and W1, and a Score column at the end. Each cell is how far the pair's price has moved on that timeframe, in percent.
| To do this | Do this |
|---|---|
| Sort | Click a column heading. Click it again to reverse. The table starts sorted by Score, highest first. |
| Open a pair | Double-click its name. The chart switches to that pair and keeps its timeframe. |
| Open a pair on one timeframe | Double-click a cell, say GBPUSD under H4. The chart switches to GBPUSD H4. |
| Change what "moved" means | The button next to the title. Prev-bar measures from the last candle's close; Bar-open measures from the open of the candle forming now. |
| See the chart behind it | Drag the small slider in the title bar to the left. Both windows have one, from 10% to fully solid. |
| Move it | Drag the title bar. |
For the first five seconds the rows re-sort as numbers arrive. After that they stay where they are, so a row does not jump while you are reading it; click a heading to sort again. A dash means there is no data for that cell yet, and pairs missing from your broker appear faded.
What do the colours and the Score mean?
Green is up, red is down, and the deeper the colour the bigger the move. Each timeframe has its own yardstick for "a big move", because 0.3% on M5 is a lot while 0.3% on W1 is barely anything:
| Timeframe | M5 | M15 | M30 | H1 | H4 | D1 | W1 |
|---|---|---|---|---|---|---|---|
| Full colour at | 0.08% | 0.12% | 0.18% | 0.28% | 0.50% | 0.90% | 1.60% |
The Score adds the seven timeframes together. Each one counts as its move divided by its yardstick, capped at +1 or −1, so the Score runs from −7 to +7. Near +7 means the pair is up strongly on every timeframe at once; near 0 means the timeframes disagree or nothing much is happening.
What they will not do
- Majors only. The eight currencies and their 28 pairs. Gold, indices, crypto and other currencies are not included.
- A picture of now, not a history. Each number is measured from the last candle or the current one. There is no line of how strength changed over the day.
- Not a signal. It tells you what has already moved. Whether that move carries on is still your call.
- Only as complete as your broker. A pair the broker does not list is left out, and its currencies are averaged over the pairs that remain.
Questions
Does MT5 have a currency strength meter?
Not built in. ApeX Trading Console adds one: ☰S on its Tools bar, covering the eight majors on seven timeframes, next to a table of the 28 pairs.
Why did new symbols appear in my Market Watch?
MT5 only sends prices for symbols in Market Watch, so the console adds the 28 pairs the first time you open either window. You can hide them again afterwards, but the windows need them to show numbers.
Why is Strength stuck on the loading list?
It is waiting for price history on all seven timeframes of every pair, which the terminal downloads the first time. After 20 seconds it shows what it has; pairs that are still missing simply cast no vote until they arrive.
Checked against ApeX Trading Console 6.593.